Background
The earliest forms of systems mapping can be traced back to the 1950s and 1960s, when researchers such as Jay Forrester and Donella Meadows began using diagramming techniques to model complex systems. Since then, the methodology of systems mapping has continued to evolve and expand, with new techniques and approaches being developed by researchers and practitioners in fields such as business, healthcare, and public policy. Today, systems mapping is used in a wide range of applications, from strategic planning and organizational design to environmental management and social change.
How to make toast
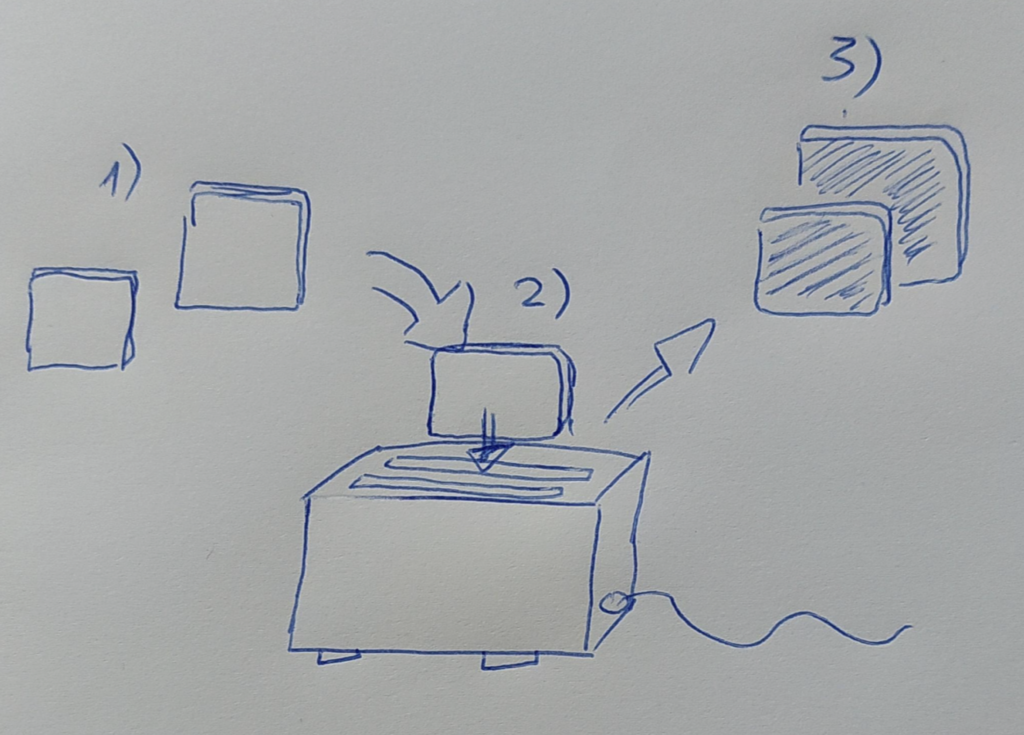
Tom Wujec, a designer, author, and educator, has developed a simple exercise which explains systems mapping in an easy and simple way. Before you start with more complex systems (see below) you can start by “drawing how to make toast”.
Tom Wujec explains the exercise on his website drawtoast.com (currently offline):
- Ask people to draw “how to make toast” on a piece of paper.
- After a few minutes ask them to share their drawings with each other. Ask them to identify differences and similarities. How would a combination of different drawings from different people could make the drawings better?
If you use this exercise to introduce the audience to systems mapping, it makes sense to watch the TED talk by Tom Wujec. In that talk he reflects on the usefulness of creating such maps co-creatively. This can be a great warm-up or start into a mapping exercise for more relevant challenge.
Step by Step Instructions
The following instructions describe a very simplified version of a systems map. We believe that already this simplified version will help you and your team. If you are interested in a more advanced description start with the video below.
- The first thing you need to think about is the question. What kind of system do you want to map? Questions could be technical such as: What does our current IT landscape look like? You can ask about stakeholders (see also stakeholder map) or questions can also be broader such as “What vision do we want to achieve?”
- Once you know the activating question ask the participants to identify the key components of the system you want to map. These components can be people, organizations, processes, resources, or anything else that plays a role in the system.
- Once you have identified the components, you can start to map out the relationships between them. This can be done in a very simple way by adding arrows and lines. Below you will find a more elaborated method as well.
- Once you have mapped out the relationships between different components, you can then use the systems map to analyze the system as a whole. You might look for patterns or trends in the relationships, identify areas of the system that are particularly vulnerable or problematic, or explore ways to optimize the system to achieve specific goals.
Optional
In a more elaborated version of a systems map there can be several different types of relationships that you might want to capture: causal relationships, feedback loops, or other forms of dependencies.
To map these in more detail, you can use different types of arrows, lines, or symbols to indicate the nature of the relationship between different components. For example,
- you might use a straight line to indicate a simple causal relationship between two components, where one component directly affects another.
- You might use a loop to indicate a feedback relationship, where changes in one component can cause changes in another component, which in turn can feed back to affect the original component.
- You might use a dotted line to indicate a weak or indirect relationship,
- or a thick line to indicate a strong or critical relationship.
An advanced description
The systems innovation network has created a vast resource on content about systems thinking.
Additional resources
Tom Wujec also gave a longer talk about solving complex (also called wicked) problems during Corona: Tom Wujec: Decision Making at Scale With Wicked Problem Solving
Leyla Acaroglu: Tools for Systems Thinkers: Systems Mapping. On medium: disruptive design, 2017.
RELATED METHODS
Working with whiteboardsAffinity Clustering
Stakeholder Map
Process Mapping
Customer and user journey map